Trends in NASA’s robotic planetary exploration program as revealed in a new datasetby Casey Dreier
|
| It enables improved inflation calculations for missions, allows for direct comparisons of White House and congressional funding, and supports insights into shifting scientific and political priorities for US investment in planetary science over time. |
The Planetary Society is making this unique dataset available for free for everyone, in a Google Spreadsheet or a downloadable Excel file. For a complete discussion of sources and methodology, please see notes on the Planetary Exploration Budget Dataset page.
The dataset includes the following unique features:
- Complete spending profiles for every planetary science mission and every major program (Mariner, Discovery, New Frontiers, etc.), broken down by development, operations, and launch costs, where possible;
- Congressionally enacted amounts for major planetary projects for all fiscal years after 2000, where specified;
- Total amounts requested by the White House and spent by NASA on its planetary exploration program, normalized to support direct comparisons;
- The raw data and program structure for nearly every planetary budget request since fiscal year 1959;
The data set enables a full reconstruction of the history of robotic planetary exploration funding by NASA’s science directorate, both as proposed and as actually spent.
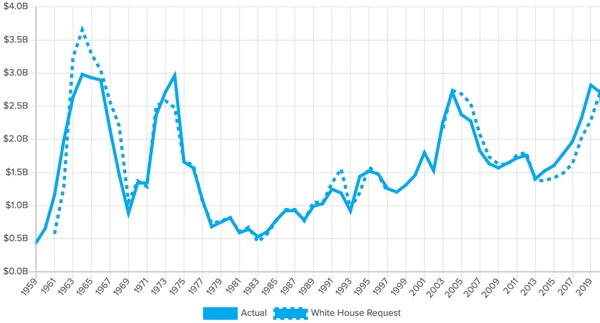 NASA’s planetary science budget, adjusted for inflation to 2020-equivalent dollars. Data normalized to maintain consistent accounting of launch costs and to remove Deep Space Network infrastructure costs between 2002 and 2007. Inflation-adjustment made using NASA’s New Start Index. Source: Planetary Exploration Budget Dataset, compiled by Casey Dreier for The Planetary Society. |
Normalizations
The program makeup of NASA’s planetary science efforts changes over time. Generally, these changes are minor, but occasionally costly programs moved in or out of the planetary science account within NASA’s budget, making it difficult to perform apples-to-apples comparisons over time. This dataset attempts to normalize out these differences to some degree, with the result that the reported totals for total planetary science program spending will not always match the official values reported in NASA’s budget estimates. These discrepancies are noted within the dataset.
It’s impossible to normalize budgetary data without imposing an opinion on “what matters,” or what is worth normalizing. As such, the raw data for every fiscal year is provided within this dataset for reference, and all normalizations are noted to enable the reconstruction of the original reporting or to enable alternate normalization strategies.
For this dataset, three normalizations were consistently applied:
- Expendable launch vehicle costs were incorporated into total mission costs and considered part of the total planetary program budget. This results in higher-than-reported reported planetary program totals from the 1960s through the 1990s, as launch costs were bookkept separately at the time.
- Due to NASA’s overall policy approach to the Space Shuttle as the lone provider of launch services in the 1980s, STS launch costs are not included in program or mission totals, though they are retained as a reference within the dataset.
- Deep Space Network infrastructure and operations costs are removed from the program totals for the fiscal years 2003 to 2007, as this was the only period in NASA’s history when they were bookkept within planetary exploration budgets.
Other considerations
Changes in public budget reporting over NASA's history occasionally leads to gaps in data, particularly for operating costs of planetary missions. In certain situations, estimated values were used to fill in these missing sections. Estimated data in this spreadsheet is always italicized, with context for the estimate noted in the source tabs.
| The dataset opens up new analyses of trends within the US planetary program. |
Beginning in fiscal year (FY) 1998 and continuing through FY 2002, NASA consolidated its astrophysics, space physics, and planetary science efforts into a single “Space Science” account, resulting in a significant loss of fidelity of planetary-related research, operations, and management costs. Previous work by Jason Callahan fills in the “actual amounts spent on the total planetary science program during FYs 1998–2001.
In fiscal year 2004, NASA shifted into a full-cost accounting method for its projects. Previously, overhead costs such as facility use and NASA employee time were accounted for in a separate, consolidated NASA account. In FY 2004, NASA began proportionally distributing these costs to individual projects. The consequence of this accounting change is that missions developed after FY 2004 will look more expensive, on average, than similar projects implemented beforehand, as they now carry NASA overhead costs within them. There is no straightforward way to normalize these two eras of NASA accounting.
This is “version 1.0” of the dataset. There are gaps, particularly during FYs 1998 and 2002, for annual operational costs of extended missions, and in early planetary programs such as Ranger and Surveyor. Corrections, additions, or suggestions that can improve this dataset are welcome. Please contact casey.dreier@planetary.org.
General trends in planetary science spending
Despite some of the considerations mentioned above, the dataset opens up new analyses of trends within the US planetary program, the full discussion of which is beyond the scope of this article. However, some general observations will be noted here.
The dataset makes it easy to group mission development and operation costs by primary destination, which provides an interesting perspective by which to evaluate NASA’s shifting priorities over time.
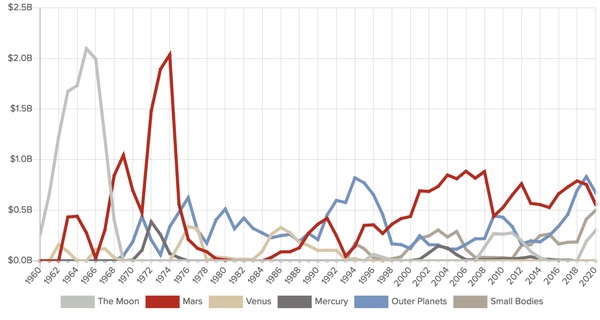 NASA planetary science mission development and operations spending, by prime destination. Inflation-adjusted using NASA's New Start Index. Source: Planetary Exploration Budget Dataset, compiled by Casey Dreier for The Planetary Society. |
This viewpoint clearly displays three eras in solar system exploration: the initial reconnaissance era of 1960 to 1980, the mature, multi-faceted era beginning in the 1990s, and the transition between those two eras in the 1980s, including the “survival crisis” of planetary exploration in the early 1980s as characterized by space historian John Logsdon.
The initial reconnaissance era was dominated by imbalanced, short-term bursts of spending on focused on a single destination, and lacked long-term sustainability.
Lunar robotic efforts, driven by the needs of Apollo, account for 57% of all planetary program spending in the 1960s. I’ve previously argued that these should be considered as part of the overall costs of Project Apollo, and the remarkably abrupt end of robotic lunar investments in FY 1969 provides additional support for that interpretation (see “A new accounting for Apollo: how much did it really cost?”, The Space Review, June 17, 2019).
Venus and Mars, our two closest planetary neighbors, are, in turn, the recipients of modest planetary mission funding beginning in the early 1960s, with the focus shifting predominantly to Mars by the late 1960s. NASA went all-in on Mars in the early 1970s, devoting 69% of its annual planetary program budget to Viking at its peak in FY 1974. After Viking, funding for Mars missions dropped just as precipitously as it did for robotic lunar exploration.
| This trend of diversification appears to be increasing and is likely contributing to a more stable funding situation, overall, compared to the first 20 years of the program. |
The remaining planets—primarily Jupiter and Saturn—came to draw the lion’s share of planetary resources from 1975 to 1995, carrying the planetary program through its nadir in FYs 1982 and 1983. Galileo, the only mission in development at the time, and the operations costs for the Voyagers and Pioneers accounted for about 75% of all funds expended on planetary exploration during those two years.
The late 1980s and early 1990s saw the first attempt to diversify the planetary portfolio by adding Magellan, Mars Observer, and Cassini/CRAF, though those projects failed to deliver on their promise to provide lower-cost exploration opportunities, with the outer planets once again coming to dominate funding with Cassini in the early 1990s.
It wasn’t until the start of the Discovery program in the mid-1990s and the institutional commitment to “better, faster, cheaper” that the resource allocations for planetary science began to diversify beyond a single dominant destination. For the first time, dedicated missions to small bodies received funding. Programs became longer-lasting. Even exploration priorities, such as Mars, were balanced out with other programs. The peak of the Mars Exploration Program activity in the first ten years of the 21st century received only 40% of all planetary program funding—significantly less than comparable eras in the 1970s or 1960s.
This trend of diversification appears to be increasing and is likely contributing to a more stable funding situation, overall, compared to the first 20 years of the program, which saw repeated roller coaster-like funding profiles.
Conclusion
The planetary exploration budget dataset is a new resource that enables new insights into the shifting priorities and focus of NASA’s robotic exploration programs. Notably, it captures the shift from the initial reconnaissance era of solar system exploration dominated by single destinations to a more mature program that balances a number of scientific goals and targets, with no single destination consuming the majority of funding.
Note: we are temporarily moderating all comments submitted to deal with a surge in spam.