Evaluating America’s green energy options including astroelectricity (part 3)by Mike Snead
|
| While we know that these can produce green electricity, the key question is, to what extent can wind and ground solar power be scaled up to replace fossil carbon fuels? |
It is now quite obvious that America still does not have a carefully engineered national energy security strategy to guide America’s unavoidable transition to green energy. The starting point for developing such a strategy is to understand America’s options for going green. The purpose of this four-part article is to evaluate America’s green energy options to determine what can practicably be used to meet America’s future energy needs—solutions capable of being put into practice from an engineering perspective. Necessarily, this article focuses on a quantitative evaluation of these options, at times necessarily delving into details to bring needed understandings to the forefront.
Summary of Parts 1 and 2
Part 1 quantitatively established why, as part of any commonsense green energy transition plan, America will need to regain its fossil fuels energy independence and maintain this independence with robust domestic fossil fuels production throughout the transition to green energy, likely for decades to come. Part 1 also explained why using political, legislative, and regulatory means to create or facilitate “pain at the pump” to encourage Americans to go green will bring economic hardship and, likely, forced energy deprivations. Wrong-headed political attempts to stigmatize middle-class Americans for America’s past and current commonsense use of fossil fuels to improve their lives are highly divisive and morally wrong. Further, they are impeding America from forging an effective bipartisan national energy security strategy to guide America’s transition to green energy.
Part 2 used the green energy transition model, shown in Figure 1, to begin quantitatively evaluating America’s green energy needs and options. In these transition models, today’s reliance on fossil carbon fuels as our primary industrial source of energy is replaced by primary green electrical power generation. The sources of this primary green electrical power can be baseload power plants and/or intermittent power sources, such as wind power.
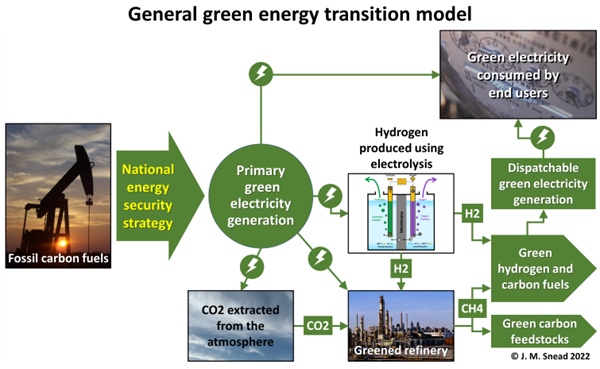 Figure 1: General green energy transition model. (Image credit: J. M. Snead.) |
As an all-electric green energy infrastructure is not practicable, in these transition models, green hydrogen and/or green carbon fuels—produced at “greened refineries” by using carbon dioxide extracted from the atmosphere combined with green hydrogen—are supplied along with green electricity to the end users. In this manner, the end users of green energy will receive electricity and fuels much as they do today with the difference being that this green energy will be produced with little or no environmental impact. Properly engineered, America’s transition to green energy should be achievable without requiring any unfavorable changes to how Americans wish to live their lives or “great reset” reductions in the standard of living. Such a properly planned approach is referred to as an “orderly” transition.
When these two types of fuels are combined with the two general types of primary electricity—baseload and intermittent—the four combinations were separately evaluated in Part 2 to provide an initial “mountain top” look at the magnitude of the new green energy infrastructure America will need. These US results, along with the comparable results of the European Union (EU), are shown in Table 1. (Note: The EU values do not include Britain.)
For ease of understanding, the Table 1 results are shown in the form of the equivalent continuous green electrical power generation capacity, expressed in gigawatts (GW), required for the US and EU to have gone green in 2020. The US would have needed 4,181–7,321 GW of equivalent continuous generation capacity while the EU would have needed 2,247–4,062 GW. The magnitude of these values highlights why America needs a well-organized national energy security strategy to guide this transition and why it will likely take America the rest of this century to complete its transition to green energy. (Note: The equivalent continuous power is expressed as gigawatts-continuous, abbreviated as “GWc”.)
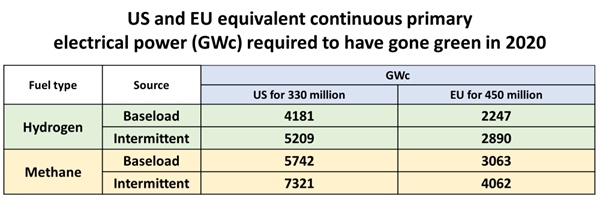 Table 1: US and EU equivalent continuous primary electrical power (GWc) required to have gone green in 2020. The EU values do not include Britain. |
The Hoover Dam has a nameplate generation capacity of around two gigawatts. To help in understanding the scale of the needed new green energy infrastructure, the equivalent number of Hoover Dams—operating continuously—needed for the US and EU to have gone green in 2020 is shown in Table 2. The United States would have needed 2,091–3,661 Hoover Dams operating continuously while the EU would have needed 1,123–2,031 Hoover Dams.
(Note: In 1929, Congress authorized $165 million for construction of the entire Hoover Dam project. The 2022 equivalent inflated cost is around $2.6 billion. Just the dam—not including the powerhouse—cost $49 million, now equaling about $900 million.)
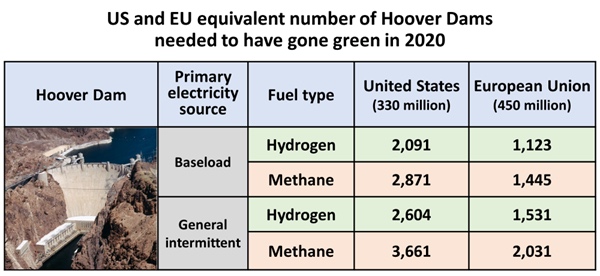 Table 2: US and EU equivalent number of Hoover Dams needed to have gone green in 2020. (Image source: US Government.) |
Part 2 finished with discussing the possible use of nuclear fission power as a substantial means of replacing fossil fuels. For the baseload-hydrogen case, Table 3 identifies how many 1-GW full-scale or 0.25-GW modular reactors would have been needed to have gone green with nuclear power in 2020. This table also includes estimates of the amount of weapons-capable fuel (U-233 or Pu-239) that must be bred each year and the amount of waste heat that must be rejected to the local environment using rivers, lakes, or the ocean.
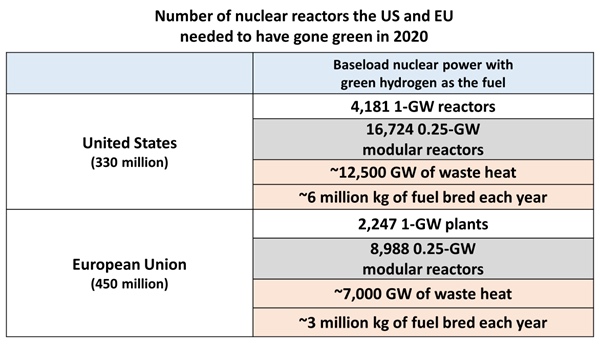 Table 3: Number of nuclear reactors the US and EU needed to have gone green in 2020. This is for the case using green hydrogen as the fuel. |
Other important concerns include safety risks involving human or naturally caused accidents (e.g., the 2011 Japanese nuclear accidents), security from terrorist or military attacks (e.g., 2022 Russian attacks near Ukraine nuclear power plants), electromagnetic pulse attacks, nuclear fuel breeding scale-up challenges, and the need for permanent nuclear waste disposal. Thus, while a renewed interest in nuclear fission power is being touted as a means for America to go green, the totality of the issues and risks associated with a substantial use of nuclear fission power makes this an unlikely and unwise choice. For these reasons, nuclear fission power was excluded from consideration as a primary means for America to go green. (See Figure 2.)
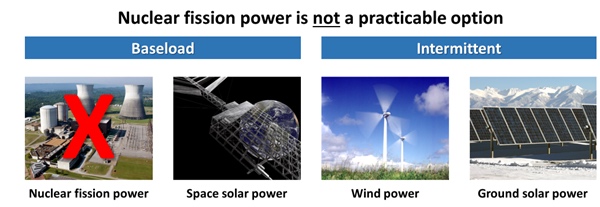 Figure 2: Nuclear fission power is not a practicable option. As discussed in Part 2, nuclear fission power has been excluded from consideration as it is not a practicable solution to substantially replace fossil carbon fuels. (Image sources: US Government.) |
Estimating America’s green energy needs in 2100
With nuclear fission power not being a practicable solution, America’s remaining large-scale terrestrial green energy options are wind and ground solar power. While we know that these can produce green electricity, the key question is, to what extent can wind and ground solar power be scaled up to replace fossil carbon fuels?
Answering this question is the focus of Part 3, which starts with estimating America’s current per-person green energy needs. This is followed by estimating America’s likely population growth in 2100, using this 2100 population size to estimate the total US green energy need in 2100, and then refining the general transition model to better handle the variability of wind and ground solar power to see if these can practicably meet US needs in 2100.
What US per person green energy needs would have been in 2019
In 2019, on average, Americans used 52.7 barrels of oil equivalent (BOE). The year 2019 was selected because this was just prior to the start of the pandemic in 2020, which temporarily reduced the per-person energy use. In 2019, the unemployment rate was low, economic growth was strong, and inflation was low. Hence, per person energy use in 2019 is the best value to use to represent the energy needed for a strong economy and good middle-class American prosperity—two important conditions that must be preserved with a well-organized national energy security strategy to guide America’s transition to green energy.
Using the transition models explained in Part 2, Table 4 shows the US per person energy use in 2019 converted into the equivalent amount of primary green electrical energy needed to supply the end users with the dispatched electricity and green fuels needed. When estimating US total energy needs through 2100, these 2019 per person values will be held constant through 2100.
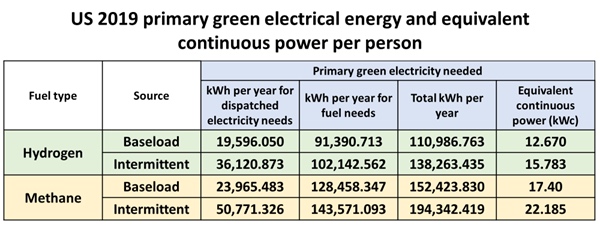 Table 4: US 2019 primary green electrical energy and equivalent continuous power per person. |
The last column of Table 4 expresses the total annual green electricity needed per person in terms of an equivalent continuous electrical power supply. The US would have needed an equivalent continuous power supply per person of about 13–22 kilowatts (kW), depending on the source of the primary power, to have gone green in 2019. For perspective, this is the power needed per person to operate 13–22 countertop microwave ovens continuously. (Note: The per person equivalent continuous power supply is expressed as kilowatts-continuous, abbreviated as “kWc”.)
The influence of net international migration on future US green energy needs
As explained in Part 2, the total US national green energy need can be estimated by multiplying theprojected US population in 2100 by the total annual green electricity needed per person.
| This means that 50% more total green energy will be needed by 2100 for America to retain a strong economy and good middle-class prosperity. |
Consequently, energy security planning, like all national planning efforts such as food security, must consider the likely future growth in America’s population. The US Census Bureau has provided future population projections that can, with judgment, be used for this purpose.
In 1999, just prior to the official 2000 national census, the Census Bureau projected future growth in the US population to the year 2100. Obviously, such prognostications are made using best guestimates of future birth and death rates, economic conditions, et cetera. To provide a broad understanding of what might transpire, the Census Bureau made four baseline projections.
With the assumption of continued net international migration to the United States, three projections were made—lowest series, middle series, and highest series—with different combinations of the key variables. From a starting population of 274 million in 1999, in 2100 the US population in the lowest series would grow only 3% to 283 million while the highest series population would grow, many times over, to 1.2 billion—to the size of China or India. In the most likely middle series—the projection typically used for planning—the US population would grow by just over 100% to 571 million in 2100.
A fourth Census Bureau projection used the assumptions for the middle series but with zero net international migration to the United States. For this case, the US population in 2100 would increase by only 38% to 377 million—194 million less than the middle series with continued immigration. Hence, with continued net international migration, common sense says that the transition to green energy would likely take longer to complete, have a higher total cost, and require a greater total amount of fossil carbon fuels to be used and carbon dioxide emitted during the transition. Obviously, US immigration policy becomes an important green energy transition planning consideration.
Estimating America’s 2100 population size
The 1999 Census Bureau projection was made at the end of a decade of low energy costs that brought increased family prosperity and public optimism. In 2016, the Census Bureau updated its US population growth projection. However, this update was only to 2060, not 2100. In this update, the projected future population size yielded a significant reduction in the future US population compared to the 1999 projection. The long-term US economic downturn that began around 2000 and strengthened in 2008—primarily due to higher energy costs—coupled with increasing public pessimism about the future, have substantially reduced US birth rates.
In Figure 3, the solid red line is the 1999 middle series projection adjusted to reflect the actual US 2020 census population. With this adjustment, the 1999 middle series projected 2100 population increased slightly from 571 million to 576 million. The red lower dashed lined represents the Census Bureau’s 2016 update to the year 2060. The red dotted extension of this line is the author’s extrapolation of the 2016 update resulting in a US population of 427 million in 2100, representing a 25% reduction from the adjusted 1999 projection of 576 million in 2100.
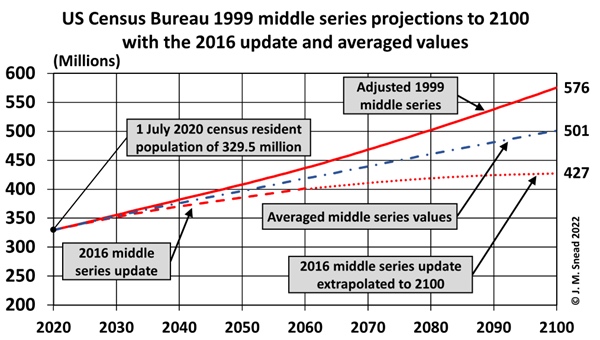 Figure 3: US Census Bureau 1999 middle series projections to 2100 with the 2016 update and averaged values. (Image credit: J. M. Snead.) |
A fundamental purpose of this assessment is to define how America can undertake an orderly transition to green energy by 2100. Done properly, this will help to return America to a level of heightened public optimism evident in the 1990s when energy prices were low. This increased optimism should be reflected in a larger US 2100 population than that using the 2016 update. Therefore, for this assessment, the adjusted 1999 projection to 2100 and the extrapolated 2060 projection to 2100 were averaged together. This yields a projected US population of 501 million in 2100—rounded down to 500 million used in this assessment. This would bring about a 50% increase in the US population by 2100. To be clear, this means that 50% more total green energy will be needed by 2100 for America to retain a strong economy and good middle-class prosperity.
First look at US 2100 green energy needs
The last column of Table 4 shows the 2019 US per-person energy use converted to an equivalent continuous supply of green electricity. As mentioned, for this assessment, these values are held constant through 2100. Thus, each of these four values can be multiplied by the projected 2100 population of 500 million to estimate the total equivalent continuous green electrical generation capacity the US will need in 2100. For example, the baseload-hydrogen value of 12.67 kWc yields 6,335 GWc.
To better appreciate the magnitude of the total green generation capacity needed, these totals can be converted into the equivalent number of 2-GW Hoover Dams. These totals are shown in Table 5. The US would need 6,335–11,093 GWc (3,167–5,546 Hoover Dams) to totally end the use of fossil carbon fuels by 2100.
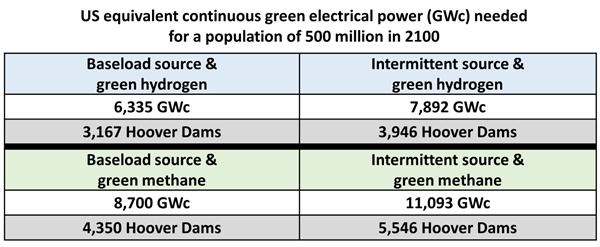 Table 5. US equivalent continuous green electrical power (GWc) needed for a population of 500 million in 2100. |
Evaluating the potential of wind power
Modeling intermittent primary electrical power
As explained in Part 2, the intermittent primary power green energy transition model shown in Figure 4 was developed to use wind power or ground solar power as the primary source of green electricity. The difference from the baseload model is that these intermittent sources of primary electrical power are not assumed to be used directly by the end users. Today, wind- and ground solar-generated electricity is sent to local utilities for dispatch to the end users. The variability of these intermittent sources is “handled” by other dispatchable sources—usually natural gas-fueled generators—to maintain the reliability of the power grid.
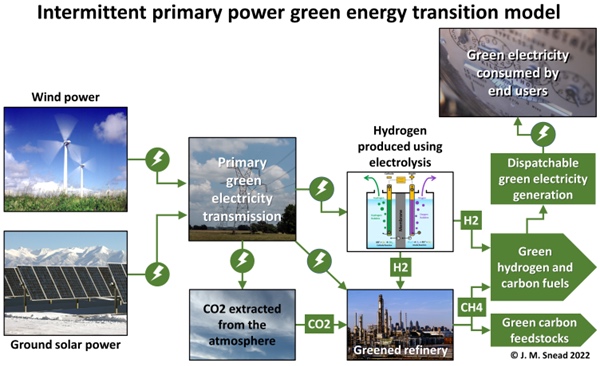 Figure 4: Intermittent primary power green energy transition model. (Image credit: J. M. Snead.) |
Figure 5 illustrates the problem with trying to go entirely green using primary intermittent power sources while having a utility dispatch this power directly to end users. This chart shows the variability of wind-generated electricity, measured every five minutes, supplying the Bonneville Power Administration in the Pacific Northwest over the entire year of 2019. Such variability is typical for most commercial wind farms. The Bonneville Power Administration handled this variability by drawing on its substantial hydroelectric reserves.
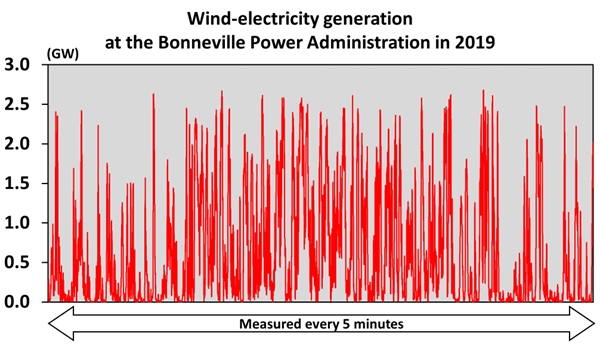 Figure 5: Wind-electricity generation at the Bonneville Power Administration in 2019. (Image credit: J. M. Snead.) |
Obviously, most of America’s 3,000 electric utilities do not have comparable hydroelectric reserves to draw on to accommodate such variability in their primary source of electricity. They would need reserves of green fuels—replacing natural gas—to power gas turbine generators to maintain grid stability. Attempting to fashion a new national green electrical power infrastructure capable of constantly managing the distribution of thousands of gigawatts of highly variable wind and ground solar electricity to meet the instantaneous needs of thousands of electric utilities is infeasible. For this reason, as shown in the Figure 4 model, the intermittent primary power variability is managed by directing all intermittent power to the production of green fuels. Using these green fuels, utilities will generate and dispatch green electricity to their customers just as they do today using fossil carbon fuels.
This approach ensures that grid stability and reliability is preserved with the transition to green energy, especially with changing demand due to weather and seasonal needs. Similarly, greened refineries supplying the utilities with green fuels will also supply green fuels (e.g., diesel and jet fuels) and chemical feedstocks to their normal customers. In this way, the transition to green energy is largely transparent to the public and would not significantly impact their lifestyle, reflecting an orderly transition.
Evaluating America’s wind power potential
The US National Renewable Energy Laboratory (NREL) evaluated the wind power potential of the contiguous United States to estimate the amount of wind-generated electrical energy that could be produced in an average year. Undertaken around 2014, the evaluation modeled both the use of then current generation commercial wind turbines as well as “near-future” turbines comparable to those now being installed.
A particularly relevant finding from this study was that the maximum land area of the contiguous United States that could be used for wind farms is about 5.2 million square kilometers—about 68 percent of the total land area. (Note: While offshore wind farms are possible, for many reasons—including the obstruction of navigation and the impact on the scenic beauty of the seashore—the substantial use of offshore wind farms is unlikely and, hence, not included in this assessment.)
For determining the wind power potential of wind farms, the three primary factors are the height of the rotor hub above the ground, the diameter of the rotor, and the average grid spacing between the turbines. The two 2014 NREL wind turbine study results of interest are for:
- 1.6-megawatt (MW) turbines with a hub height of 110 meters, a 100-meter rotor diameter, and a wind farm square grid spacing of 0.8 kilometers. These values reflect turbines typically installed in 2014.
- 1.8-MW turbines with a hub height of 140 meters, a 124-meter rotor diameter, and a wind farm square grid spacing of 0.992 kilometers. These values reflect turbines that are now often being installed.
As the wind passes across the Earth’s surface, especially over land, obstructions slow the wind’s speed. This creates a boundary layer that reduces a wind turbine’s performance. Hence, the hub height of each new generation of turbines has been increasing to raise the rotors farther away from the ground to increase performance. As the hub height increased, the rotor diameter also increased to “capture” more wind power per turbine. However, there is a limit to these increases as the newer turbines’ spinning rotors are now beginning to intrude into the airspace used by general aviation aircraft.
| Wind power alone is not a practicable way for America to primarily replace fossil carbon fuels. Further, it is unlikely that Americans will accept covering a large part of the country in a forest of wind turbines. |
A wind turbine’s rotor extracts power from the wind by slowing the air passing over the rotor’s blades. In doing so, the wind’s power is transferred into spinning the rotor which, in turn, spins a generator to produce electrical power. However, as this happens, the wind exiting the spinning rotor has been slowed and made turbulent. If the next turbine is too close, the power generated is reduced. The remedy is to increase the grid spacing so that the exiting wind can mix with higher speed wind flowing around the rotor, regaining much of its lost speed. This mixing also reduces turbulence downwind from the rotors—turbulence that can mechanically damage a turbine’s machinery. Having studied these issues, NREL concluded that the optimum grid spacing that maximizes the wind farm’s total power produced equals 8 rotor diameters. For example, using the near-future 1.8-MW turbines, 8 × 124 meters = 992 meters—almost 1 kilometer—is the modeled grid spacing for these turbines.
Another key parameter in estimating the annual power that a wind farm can produce is the gross capacity factor (GCF). For example, assume a single turbine has an installed nameplate power of 1,600 kW or 1.6 MW. If this turbine produced 1.6 MW of power continuously for the entire year, it would have a gross capacity factor of 100%. Of course, the variability of the wind prevents this. Thus, the average percentage of the total possible energy produced is called the gross capacity factor. At the very best wind farm locations, this factor can be as high as around 60% while in the worst locations it can fall almost to zero. For this assessment, a lower GCF cutoff value of 20% is used.
Estimating the wind-generated energy potential of the contiguous US
In the NREL analysis, the entire contiguous US was divided into square areas—20 by 20 kilometers—with land unsuitable for locating wind farms such as wilderness areas, urban areas, parks, and water features being excluded. Within each square, the gross capacity factor for each of the two turbine sizes was estimated. By combining the gross capacity factor of each square with the nameplate power of each turbine size and the number of turbines per square kilometer, the wind-generated energy potential in each square in an average year can be estimated. Using this estimate, color-coded maps can be created for each turbine size, such as the map for the 1.6-MW turbine shown in Figure 6. The darker color of a square generally indicates a greater potential to generate energy in an average year.
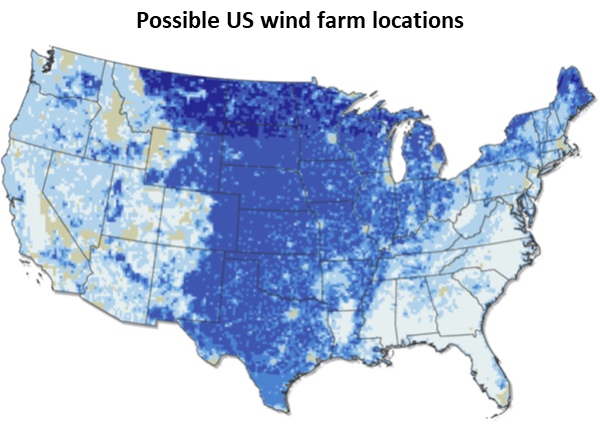 Figure 6: Possible wind farm locations. The color code of each 20 km by 20 km square indicates the wind-generated energy potential when using 1.6-MW wind turbines. The darker the blue color the greater the potential to generate energy in an average year. For this map, the gross capacity factor must be 35 percent or greater. (Image source: US Government.) |
The overall results of their evaluations were reported by NREL in the manner shown in Figure 7. For the two turbine sizes, the cumulative land area on which commercial wind farms could be built as a function of the minimum gross capacity factor is plotted. These results show that no area of the US could have wind farms with a gross capacity factor greater than around 66%. However, with a minimum gross capacity factor of only 20%, wind farms could be built on around 5 million square kilometers.
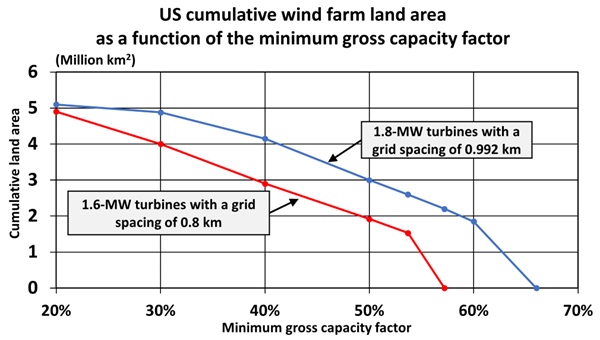 Figure 7: US cumulative wind farm land area as a function of the minimum gross capacity factor. (Data source: US Government. Image credit: J. M. Snead.) |
The problem with this chart is that it does not indicate how much wind-generated electrical energy could be expected in an average year. To determine this, the Figure 7 data was further analyzed by the author to express those results in terms of the equivalent continuous power that could be produced as a function of the percentage of the US total contiguous land area used for wind farms.
In Figure 8, the horizontal axis is the percentage of the land area of the contiguous US used for wind farms. The vertical axis shows the GWc of primary electrical power that would ideally be produced in an average year. The red and blue lines plot the data for the two turbine sizes. Focusing on the left end of the red line for the 1.6-MW turbines, wind farms built on the best 20% of the contiguous US, where the gross capacity factor is 54% or greater, could generate slightly more than 2,000 GWc. As wind farms are built on more areas, eventually a limit is reached—at the right end of the line—where the gross capacity factor falls to at least 20%. When taken together, all of these wind farms would then be able to generate, in an average year, an estimated 5,254 GWc. This value represents the best wind energy potential of the contiguous US in an average year.
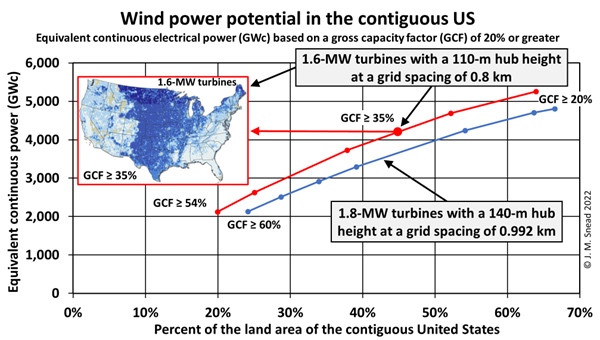 Figure 8: Wind power potential in the contiguous US. This data is for an average year. This data excludes land unsuitable for locating wind farms such as wilderness areas, urban areas, parks, and water features. In the map, the blue areas indicate that some wind power potential exists within each 20 km x 20 km area. Areas with a darker blue color have the best potential. (Map source: US Government. Image credit: J. M. Snead.) |
Surprisingly, in the NREL study, the taller and larger 1.8-MW turbines yielded a lower total output of 4,807 GWc. The reason is the larger rotors required a larger grid spacing, resulting in fewer turbines per unit area. (This result is an example of why engineers do trade studies.)
To achieve the maximum output using the 1.6-MW turbines (red line), these wind farms would cover 4.9 million square kilometers or about 64% of the contiguous US. About 7.8 million turbines would be used with a total installed nameplate capacity of 12,250 GW. As a matter of interest, the effective national average gross capacity factor would be 5,254 GWc ÷ 12,250 GW = 43%.
Estimating America’s wind energy potential for planning purposes
As the name suggests, the gross capacity factor is an ideal value based primarily on hub height, rotor diameter, and grid spacing. This value does not reflect the actual amount of energy that would be produced. To accommodate transformer losses, rotor wake losses, control algorithm losses, blade contamination, icing, and turbine availability losses, an adjustment is needed to take these losses into account. (Note: Electrical power transmission losses are already included in the intermittent model.) Available information suggests a reduction to 90.5% be used to account for these losses. Hence, the adjusted 1.6-MW gross equivalent continuous power becomes 0.905 × 5,254 GWc = 4,755 GWc in an average year.
A second adjustment is needed to account for year-to-year variability. NREL studies of the year-to-year variability of wind farms suggests the use of a reduction to 80% of the average year value to plan for a low-wind year. Thus, the final 1.6-MW equivalent continuous power planning value would be 0.8 × 4,755 GWc = 3,804 GWc for a low-wind year.
(Note: While beyond the scope of this top-level assessment, extreme weather or other national energy security needs, such as war, will also need to be addressed when planning America’s green energy transition.)
Wind power’s potential to enable America to go green
From Table 5 above, the general average-year intermittent case using hydrogen would require 7,892 GWc in 2100. To try to meet this need with only wind power in a low-wind year, slightly less than 48% of the US total annual energy need in 2100 could be met for a population of 500 million.
From Table 5 for a population of 500 million in 2100, the more likely intermittent-methane case would require 11,093 GWc. In a low-wind year—and not reflecting severe weather or other unusual needs—only about one-third of the US annual energy need could be met.
From these estimates, wind power alone is not a practicable way for America to primarily replace fossil carbon fuels. Further, it is unlikely that Americans will accept covering a large part of the country in a forest of wind turbines to accommodate the desires of fervent environmentalists primarily living in urban areas where wind farms would not be built.
Imagine an America using only wind power
For a moment, imagine that “great reset” energy policies force America to go green using just the available land-based wind power. The US would then have 4,755 GWc available in an average year.
As discussed in Part 2, in 2019 the US used 52.7 BOE of total energy per person. This was what was needed for full prosperity prior to the start of the pandemic. If America only had 4,755 GWc to go green, the US per person total energy use would need to decline to the equivalent of about 23 BOE per year to make do with only wind power.
Historically, this 22.6 BOE is about where the US was in terms of per person energy use over a century ago. When the possibility of a low-wind year is considered, the available total energy would be significantly lower. Again, this shows that wind power alone is not a practical way for America to easily go green without forcing energy impoverishment on Americans and risking the safety of Americans during periods of severe weather.
Evaluating the potential of ground solar power
With ground solar power also being an intermittent power source, we will again use the intermittent green energy model to evaluate its potential to meet the US green energy needs in 2100.
Modeling ground solar power-generated electricity
After evaluating a wide range of ground solar power technologies, NREL reported in 2013 that utility-scale solar farms using fixed photovoltaic (PV) arrays, on average, generated 67 gigawatt-hours (GWh) per square kilometer per year. Substantial improvements in the efficiency of PV systems have been made since 2013. However, the 2013 estimates were influenced by many early large solar farms having been built in the very sunny American Southwest. Any substantial expansion of ground solar power will require that solar farms be built in less sunny locations. Therefore, for this top-level assessment, any potential increase in PV efficiency is assumed to be offset by the lower average power generation potential of the expanded area of needed solar farms.
Using this NREL 2013 value, the average annual PV equivalent continuous electrical power is estimated to be 0.007648 GWc per square kilometer of solar farms.
(Note: Unlike for wind power, no adjustment for year-to-year variability in ground insolation is included in this assessment as this is believed to be minimal. Inverter losses—to convert the direct current power generated by the PV panels into alternative current power to send from the solar farm—are presumed to be included in the NREL estimates.)
For perspective, it would take about 131 square kilometers of ground solar farms to ideally equal the continuous output of a 1-GW nuclear power plant.
Land area needed for solar farms in 2100
From Table 5, to meet the total annual energy needs of a projected US 2100 population of 500 million, the intermittent-hydrogen case would require 7,892 GWc while the intermittent-methane case would need 11,093 GWc. For the intermittent-hydrogen case, 1 million square kilometers of solar farm land, covering 13% of the contiguous US, would be needed. For the intermittent-methane case, this increases to 1.45 million square kilometers, covering 19% of the contiguous US. Each person would need nearly 2,900 square meters—three-quarters of an acre—of land.
| Broadly across the contiguous US, about 1 million square kilometers of land are used for growing crops. Even if all of this cropland could be turned into solar farms, the US would still not be able to meet its 2100 energy needs with only ground solar power and methane. |
The land area in these calculations only represents the total solar farm area within the perimeter fence. This does not include the additional land needed for substations and the extensive rights-of-way for the overhead high-voltage power transmission lines needed to convey this power hundreds of kilometers to reach the facilities used to manufacture green fuels. Thus, a land use adjustment factor needs to be included.
To estimate the total gross land area needed for the all-solar solution, an assumed adjustment factor of 1.2 is used. For the likely methane case, the total land area needed increases to 1.2 × 1.45 = 1.74 million square kilometers or about 23% of the contiguous US. Thus, to use only ground solar power to go green by 2100, nearly one-quarter of the contiguous US would be covered in either solar farms or transmission lines.
While solar farms have been built in the sunny Southwest, the extremely arid and fragile nature of the land makes an extensive expansion of solar farms in this part of America unlikely. Thus, most solar farms would necessarily need to be built elsewhere. It is important to understand that solar farms and crop land essentially compete for the same land as both need sunshine and relatively flat land. Broadly across the contiguous US, about 1 million square kilometers of land are used for growing crops. Even if all of this cropland could be turned into solar farms, the US would still not be able to meet its 2100 energy needs with only ground solar power and methane. Obviously, any substantial expansion of ground solar power would also likely threaten US food security—an especially important consideration with a possible 50 percent increase in population by 2100.
Key points of Part 3
- With continued net international migration to the United States, the US population will likely climb by about 50% to around 500 million by 2100.
- Wind power and ground solar power are not practicable options for America to go green.
What’s ahead in Part 4–Conclusion
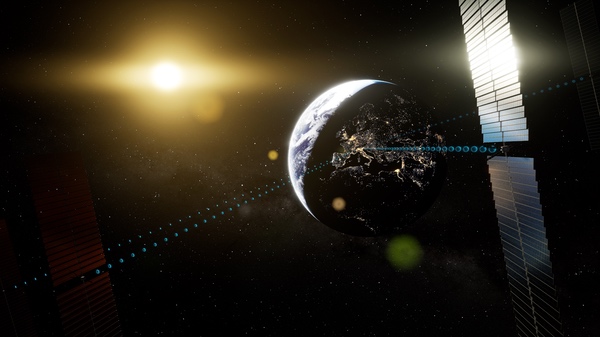
With nuclear fission, wind, and ground solar power being eliminated as real options for America to transition to green energy, space solar power-generated astroelectricity is the remaining American primary green energy option. Part 4 will assess if space solar power provides a practicable means for America to transition to green energy. (See Figure 9.) Part 4 will conclude with suggested guidance for creating a national energy security strategy to successfully guide America’s needed orderly transition to green energy.
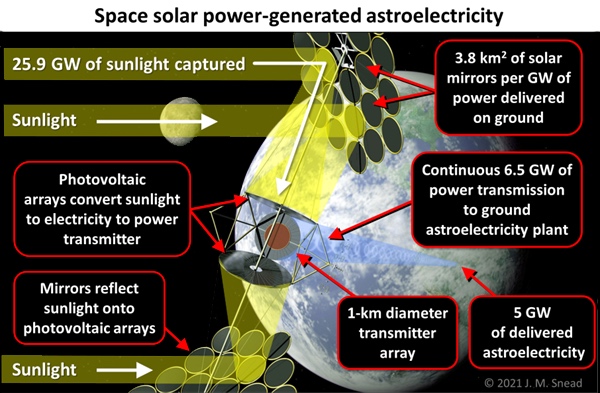 Figure 9: Space solar power-generated astroelectricity. (Original image source: US Government. Modified image credit: J. M. Snead.) |
Author’s note
The quantitative information presented in this article is provided for information purposes only and is not intended to be used for any other purposes. The author believes that the information provided is accurate, consistent with the top-level nature of these analyses and the sources of information used.
Note: we are using a new commenting system, which may require you to create a new account.