Assigning an identification to a satelliteby Charles Phillips
|

| If the objects have rates of change of RAAN that are approximately parallel, they are very likely to be from the same launch. |
Another label they assign is the Committee on Space Research or COSPAR designator, which is commonly used by many organizations instead of the satellite number. US Space Force refers to the COSPAR as the “International Designator.” This identifies which launch the satellite originates from, although the assignment is somewhat arbitrary. For instance, if a weather satellite is launched from China, the payload, the upper stages, any debris, and other objects will get sequential satellite numbers and all will share the same COSPAR basic designation. So you can later tell which launch objects such as the upper stage came from.
Now there are some exceptions: if a small satellite is launched from Baikonur on a Progress and that Progress transfers it to the ISS, and the satellite is later deployed from ISS, the satellite gets the COSPAR designation from the Zarya segment of the ISS. I have written several stories about the Satellite Catalog since it is so significant and yet has so many errors (see “Time for common sense with the satellite catalog”, The Space Review, April 10, 2017.)
But some satellites do not have a COSPAR designator: these are non-cataloged “analyst” satellites. These analyst satellites currently have satellite numbers in the 80,000 range; many of these are satellites that are routinely tracked but have not yet been added to the Satellite Catalog.
Introducing the “RAAN Test”
I have previously described something that I call the “RAAN Test”, a way to verify that the assignment of the satellite number or COSPAR designation is correct. I believe that I am the first person to use this exact method of plotting angles to verify the satellite number or identify which launch a satellite originated from. The idea, backed up by my research, is that when objects start in the same orbit, they have a very regular change in some angles that define the orbit (see “A possible technique for giving names to nameless satellites”, The Space Review, October 28, 2019.)
But orbits can be defined as a set of six numbers at a specific time, with one set a vector with an X, a Y, and a Z location vector from the center of mass of the Earth. Add to those the rate of change of those vectors, the velocity of the satellite. These are valid at a time referred to as the Epoch. Another set of numbers is a Keplerian set: these include numbers like the eccentricity and inclination, something that we can visualize.
One of the angles that defines orbits in the Keplerian set has a complex name: the Right Ascension of the Ascending Node, or RAAN. Think of this angle as the one that tells us which part of the Earth the satellite’s orbit currently passes over. If we take sets of orbital parameters and their epoch times and plot the values of RAAN for an object, the change is very constant. Over time, the orbit “precesses” around the Earth and so we can refer to these plots as plots of RAAN precession. If we have several objects from the same launch, we see that they start at the same point in the orbit and have similar rates of change of RAAN. My contention is that if the objects have rates of change of RAAN that are approximately parallel, they are very likely to be from the same launch. A very interesting exercise is to plot objects from the same launch where there are multiple payloads and also pieces of debris.
A simple example
Normally the least interesting plot is of a very recent launch since all objects will have the same RAAN values and the same rate of precession, but it is important to demonstrate that and not just claim it. Figure One shows COSPAR 2024-066, a recent launch that occurred on April 7, 2024, and had 11 objects.
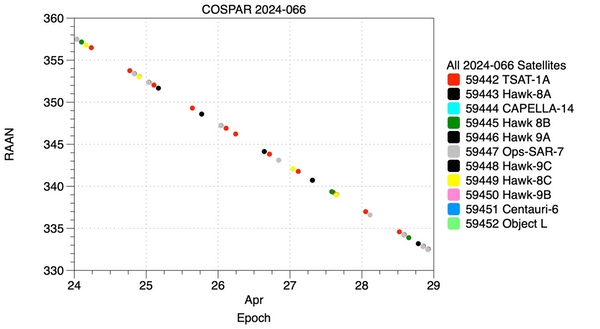 Figure One COSPAR 2024-066 |
And as should be, all the objects generate a single line in the plot. They are at a stable altitude of over 550 kilometers and so separation due to atmospheric drag will happen only slowly. Probably Object L, satellite 59452, is a piece of light debris and will separate first. The Common Name could be changed from Object L to some “Falcon Debris” since it launched on a SpaceX Falcon, but that will likely not be done. Possibly someone knows which of the payloads from that flight generated the debris.
A more interesting example
Figure Two shows an older Chinese launch, Fengyun 3D, which has two payloads, an upper stage, and later had two pieces of debris cataloged. We know that they are all from the same launch from the COSPAR identifier , which I contend we can because the plotted lines are parallel.
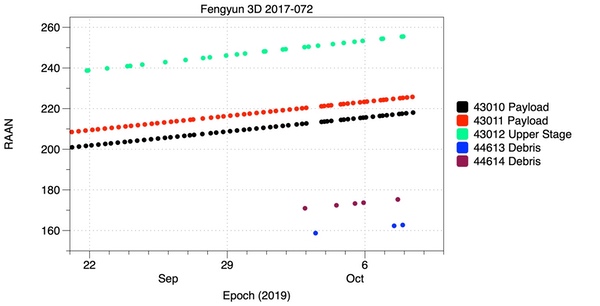 Figure Two Fengyun 3D |
As you can see, the objects generate nearly parallel lines which indicate the rates of change of RAAN. The payloads are tracked most often and the upper stage is tracked often since it is large, so they have the most points. The two pieces of debris were probably followed for a while and cataloged later—as we can tell from the satellite number—and they are also tracked less often. They were certainly tracked as “Analyst Satellites” for a while but the lines are nearly parallel. Space Track also has a group of satellites whose satellite numbers are in the 8x,xxx series of numbers. These are “analyst” satellites that are often regularly tracked but are not in the Satellite Catalog. Over time, a number of those eventually are cataloged. When I was an orbital analyst, I created Analyst Satellites on objects that I was not sure would be large enough or stable enough to be regularly tracked, and if they were tracked I would catalog them.
This test has been a big part of several articles that I have written since they tell us a lot about the objects from a launch. If you plot RAAN precession for objects from different launches, you will see breaks in these lines and the different lines will not be (nearly) parallel.
A case where apparently a substitution happened
This test has many uses, one of which is to verify that an object is actually the same object and has not been switched with another object. One example is object 26870, which was an upper stage from a Russian launch which launched on July 30, 2001. It apparently was “lost” by the people of Space Track in July of 2017. We can look at the orbits available on Space Track and see that it was routinely tracked up until that time, and we can calculate that the perigee was about 105 kilometers or so: it apparently reentered the atmosphere but that was missed. It had a very high apogee and so it was moving very fast at perigee; those objects will build up a lot of atmosphere ahead of them, which causes the drag to be very high. Oddly, in March of 2018 someone assigned some recent tracks to that object and the object was “found”. But if you look at Figure Three, the RAAN values and the rate of change of RAAN was very different for the two objects. From RAAN Test, we can see that these were two very different objects.
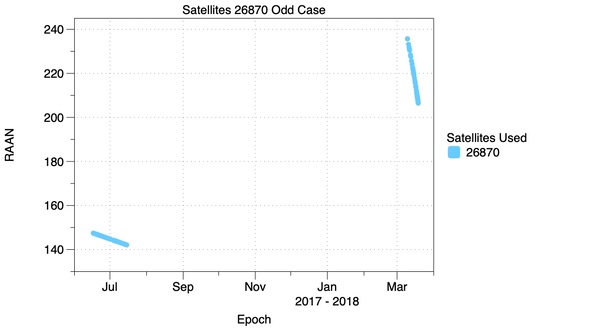 Figure Three RAAN Test for 26870 |
Now don’t mistake the values of RAAN as being indicative of orbital height, but in this case both of those satellites did have very low perigees.
If you check the released orbital parameters for Object 26870 you will see that the perigees that are down to about 100 kilometers, the satellite had a higher apogee but was not likely to survive a perigee passage or two.
Another satellite found
Another interesting case is object 7244, COSPAR 1974-020B. This is Ops 4547, a subsatellite from a KH-9 Hexagon flight. It was the Infrared Calibration Balloon (IRCB) and was launched into a low orbit and then boosted into a higher orbit for operation. Apparently it failed and never inflated. It was “lost” for a couple of years and then “found” and has recently been found again: there are TLEs from 1974 to 1976, from 1979 to 1982, and again this year. If we look at the apogee and perigee of that object, we see that the various perigees (and apogees, though I did not include that plot to save space) look reasonably consistent. Figure Four is a plot of the perigee of Object 7244.
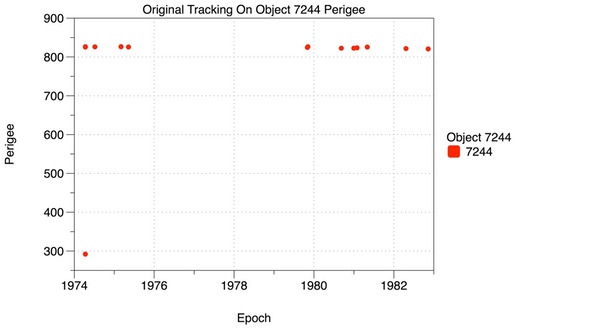 Figure Four Perigee Of Object 7244 |
But, if you plot the values of RAAN, there is no pattern at all, as you can see in Figure Five.
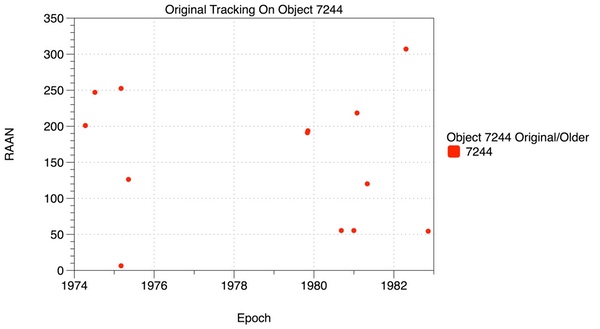 Figure Five RAAN Test for Older Parameters for Object 7244 |
One reason that this case is very interesting to me is that I was an Orbital Analyst who was maintaining the Satellite Catalog from 1978 until 1982, so I would have probably looked at this satellite. We did find lost satellites often, but normally they were lost for only a few months. We used a technique to verify that observations were on the same satellite that was only good for a few months at a time at most. However, we had the ability to produce very accurate orbital parameters so why does this not show any pattern? And how did someone conclude that observations on a satellite were on 7244 if it had been lost for several years? Possibly this was in cooperation with the Naval Space Surveillance Center (NAVSPASUR) but that is something that we also do not have the room to discuss in depth. Some people could speculate that we could have used Space Object Identification (SOI) to tell that it was the same satellite but that does not make sense. I used SOI to distinguish between satellites in a new launch: you could tell the payload from an upper stage. But all objects like this that were not under control would look alike.
And then how did this satellite go lost again for many years?
Now if you plot the new 7244, it is definitely a single satellite. But there is no similar trend in the earlier orbital parameters. Figure Six shows this.
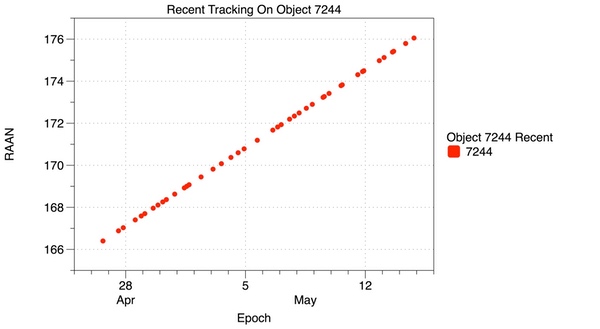 Figure Six RAAN Test for 7244 |
This test seems to have some usefulness is verifying that satellites which have been lost have actually been found, and I am working on some other uses.
One thing that I have done a lot is use RAAN Test to try to find satellites whose identifications have been switched, and also to try to assign a COSPAR identifier to satellites which do not have one assigned. That will be the subject for a future article.
| This test seems to have some usefulness is verifying that satellites which have been lost have actually been found, and I am working on some other uses. |
Certainly we have to talk about what causes this precession of RAAN and that is best explained in an excellent text that goes back to the early days of satellite tracking, the “Bate, Mueller, and White” text as updated by William Saylor. This is an update to a classic text that many generations of orbital analysts have learned from. On page 127, the authors explain (footnote 1) that the Earth is not spherical, but due to its rotation has a bulge which tapers to the Equator, so there is more mass in the equatorial plane and surrounding it. This mass exerts a force on the satellite that accelerates it toward the Equator and produces a torque that turns the orbital plane. Please refer to the book for a more in-depth explanation which we don’t have room for here.
One thing that I would like to look at is that the mass of the Earth is not distributed evenly and so the orbits would see an additional but much smaller torque at different parts of the orbit.
Acknowledgement
This article could not have been written without help from colleagues. Mike Marston wrote the essential parts of a critical piece of software that was used to sort and group satellites. He is far better at writing C and C++ code than I am. The plots were produced with a very well designed application, DataGraph and I got a lot of help from Pamela Schultz, PhD, who answered my questions. Most people make plots using another application but DataGraph is far faster and more intuitive.
This technique is inspired by a program that I used as an orbital analyst: FLINT. I have forgotten what that acronym meant but it was intended to help orbital analysts catalog objects in a launch but proved to be very useful in many situations. That program ran on the 427M computer system that we used to maintain the Catalog and plotted the “residuals” in time to allow us to compare observations to element sets. It was only good for short durations since the residuals could rapidly get to be too large. In contrast, RAAN Test compares orbital elements instead of residuals and is best used over durations of weeks or months.
These plots may also be a little reminiscent of the “Gabbard” diagrams used by the NASA Orbital Debris Program office and others, but the RAAN Test allows us to follow which satellites are identified as which over months.
Endnotes
- Fundamentals Of Astrodynamics, Second Edition, Bate, Mueller, White, and Saylor. Dover Publications 2020. Page 127.
Note: we are now moderating comments. There will be a delay in posting comments and no guarantee that all submitted comments will be posted.