Assigning an identification to a satellite, revisitedby Charles Phillips
|

| My contention is that if the objects have rates of change of RAAN that will generate lines that are approximately parallel, they are very likely to be from the same launch. |
The US Space Force refers to the COSPAR designator as the “International Designator”. This identifies which launch the satellite originates from, although the assignment is somewhat arbitrary. COSPAR designators tell the sequential number of each launch, each year, and adds alphabetic character (or characters) to distinguish each object. So if a launch is the fifth one of 2025, the COSPAR designation for the objects will be 2025-005 A, B, C, etc.
There are problems with this somewhat obsolete practice. However, it does help in somae cases. For instance, if a weather satellite is launched from China, the payload, the upper stages, any debris, and other objects will get sequential satellite numbers and all will share the same COSPAR basic designation. Thus, you can later tell which launch objects such as the upper stage came from. Now there are some exceptions: if a small satellite is launched from Baikonur on a Progress and that Progress transfers it to the ISS, and the satellite is later deployed from ISS, the satellite gets the COSPAR designation from the Zarya segment of the ISS.
They also add a Common Name, though there are a lot of problems with that process which we don’t have room to talk about in this article.
I have written several stories about the satellite catalog since it is so significant and yet has so many errors. (See “Time for common sense with the satellite catalog”, The Space Review, April 10, 2017.)
But some satellites do not have a COSPAR designator: these are non-cataloged “analyst” satellites. These analyst satellites currently have satellite numbers in the 80,000 range; many of these are satellites that are routinely tracked but have not yet been added to the satellite catalog.
Introducing the “RAAN Test”
One thing that I have written about before is something that I call the RAAN Test, a way to verify that the assignment of the satellite number or COSPAR designation is correct. I believe that I am the first person to use this exact method of plotting angles to verify the satellite number or identify which launch a satellite originated from. The idea, backed up by my research, is that when objects start in the same orbit they have a very regular change in some angles that define the orbit. This article is too short for us to go into a long discussion of orbits but some articles that I have written before go into some detail. (See “A possible technique for giving names to nameless satellites”, The Space Review, October 28, 2019.)
Orbits can be defined as a set of six numbers at a specific time. One set is a vector with an X, Y, and Z location vector from the center of mass of the Earth. Add to those the rate of change of those vectors, or the velocity of the satellite. These are valid at a time referred to as the epoch. Another set of numbers is a Keplerian set: these include numbers like the eccentricity and inclination—numbers that are something that we can visualize.
One of the angles that defines orbits in the Keplerian set has a complex name: the Right Ascension of the Ascending Node or RAAN. Think of this angle as the one that tells us which part of the Earth the satellite’s orbit currently passes over. If we take sets of orbital parameters and their epoch times and plot the values of RAAN for an object, the change is very constant. Over time, the orbit “precesses” around the Earth and so we can refer to these plots as plots of RAAN precession. If we have several objects from the same launch, we see that they start at the same point in the orbit and have similar rates of change of RAAN. My contention is that if the objects have rates of change of RAAN that will generate lines that are approximately parallel, they are very likely to be from the same launch. A very interesting exercise is to plot objects from the same launch where there are multiple payloads and also pieces of debris, you can see that they will have very similar rates of RAAN precession despite the difference in mass of the objects.
A simple example
Let’s take a look at the plot of a very recent launch where we will see that all objects will have the same RAAN values and the same rate of precession, but it is important to demonstrate that and not just claim it. Figure One shows COSPAR 2024-066, a launch that occurred on April 7, 2024, and had 11 objects.
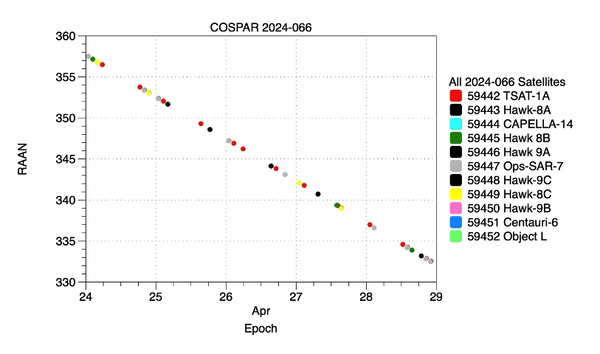 Figure 1: COSPAR 2024-066 |
And as should be, all the objects generate a single line in the plot. They are at a stable altitude of over 550 kilometers and so separation due to atmospheric drag will happen only slowly. Since I wrote the earlier story, satellite 59452, which I thought was a piece of light debris, was cataloged as Korsat-1, so it was a payload.
A more interesting example
Figure 2 shows an older Chinese launch, the Fengyun 3D, which has two payloads, an upper stage, and later had two pieces of debris cataloged. We know that they are all from the same launch from the COSPAR identifier, which I contend we can believe due to the fact that the plotted lines are parallel.
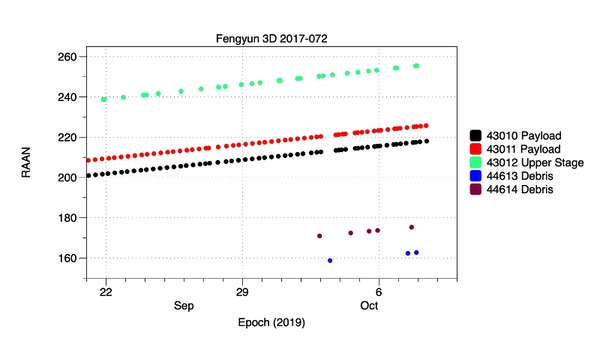 Figure 2: Fengyun 3D |
As you can see, the objects generate nearly parallel lines that indicate the rates of change of RAAN. The payloads are tracked most often and the upper stage is tracked often since it is large, so they have the most points. The two pieces of debris were probably followed for a while and cataloged later, as we can tell from the satellite number; they are also tracked less often. They were certainly tracked as “analyst satellites” for a while, but the lines are nearly parallel. As I said before, Space Track also has a group of satellites whose satellite numbers are in the 8x,xxx series of numbers. These are “analyst” satellites that are often regularly tracked but are not in the satellite catalog. Over time, a number of those eventually are cataloged. When I was an orbital analyst, I created analyst satellites on objects that I was not sure would be large enough or stable enough to be regularly tracked, and if they were tracked I would catalog them.
| A very interesting exercise is to plot objects from the same launch where there are multiple payloads and also pieces of debris, you can see that they will have very similar rates of RAAN precession despite the difference in mass of the objects. |
Certainly, we must talk about what causes this precession of RAAN and that is best explained in an excellent text that goes back to the early days of satellite tracking, the “Bate, Mueller, and White” text as updated by William Saylor. This is an update to a classic text that many generations of orbital analysts have learned from. On page 127 of the book, the authors explain[1] that the Earth is not spherical, but due to its rotation has a bulge that tapers away from the Equator, so there is more mass in the equatorial plane and surrounding it. This mass exerts a force on the satellite that accelerates it toward the Equator and produces a torque that turns the orbital plane. (Please refer to the book for a more in depth explanation which we don’t have room for here.) But I will say that the inclination is very important for the RAAN precession rate, the cosine of inclination is in the numerator of the equation that allows us to calculate RAAN precession rate along with the geopotential coefficient J2.[2]
Thus, objects in very similar inclinations will have very similar RAAN precession rates, and we have to look at where the orbits are, what are the values of RAAN.
The RAAN Test also includes the actual values of RAAN: many satellites are put into “planes” to provide coverage over parts of the Earth while dispersion around the plane gives coverage in polar and equatorial regions simultaneously.
A good example of this is the Chinese Yaogan constellation, which consists of various intelligence gathering satellites. Let’s look at two of their electronic intelligence launches. There have been launches into several planes, and there are several satellites in each launch that spread out in the plane of the orbit. They have used several inclinations, but for this example I am using two that are at approximately 63 degrees. If you plot these planes, they have different values of RAAN and so are distributed around the Earth. But they all have almost the same RAAN precession rates, so the planes remain evenly distributed around the Earth. To tell if an unknown satellite was from a Yaogan launch you need to identify which plane it is in and also see if the precession rates match.
 Figure 3: Planar Separation Of Two Chinese Satellite Launches |
Note that I give the common names from the satellite catalog: this is one area where they have no consistency. One launch had names with dashes and one did not. I did not plot all of the objects from either launch since the lines just overlap each other. I have more plots that include other Yaogan launches but this one is representative and presents a clear picture.
Hopefully soon I can report on some of my progress of assigning COSPAR designations to analyst satellites with this technique. That is very time consuming.
Acknowledgement
This article could not have been written without help from colleagues. Mike Marston wrote the essential parts of a critical piece of software that was used to sort and group satellites. He is far better at writing C and C++ code than I am. AJ Dormer also has helped enormously with software: he is really good at it and very helpful. The plots were produced with a very well-designed application, DataGraph, and I got a lot of help from Pamela Schultz, PhD, who answered my questions. Most people make plots using another application but DataGraph is far faster and more intuitive.
This technique is inspired by a program that I used as an orbital analyst – FLINT. This is Foreign Launch Interactive Piece Separation (obviously the author came up with an acronym that he wanted) by USAF Captain William E. Wiesel. We used it for many tasks: cataloging objects from launches, processing maneuvers, and so on. That program ran on the 427M computer system that we used to maintain the catalog, and plotted the “residuals” in time to allow us to compare observations to element sets. It was only good for short durations since the residuals could rapidly get to be too large. By contrast, RAAN Test compares orbital elements instead of residuals and is best used over durations of weeks or months.
These plots may also be a little reminiscent of the “Gabbard” diagrams used by the NASA Orbital Debris Program office and others, but the RAAN Test allows us to follow which satellites are identified as which over months.
Endnotes
- Fundamentals Of Astrodynamics, Second Edition, Bate, Mueller, White, and Saylor. Dover Publications 2020. Page 127.
- Fundamentals Of Astrodynamics, Second Edition, Bate, Mueller, White, and Saylor. Dover Publications 2020. Page 352.
Note: we are now moderating comments. There will be a delay in posting comments and no guarantee that all submitted comments will be posted.